Top Free Charting Softwares

For traders and investors seeking to make informed decisions in the dynamic world of financial markets, charting software is an indispensable tool. Fortunately, a wide array of free charting software options is available, offering advanced technical analysis features without breaking the bank. In this article, we’ll explore a curated list of free charting software that empowers users with the tools they need to analyze trends, patterns, and make well-informed investment decisions.
- TradingView
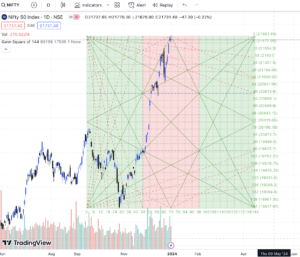
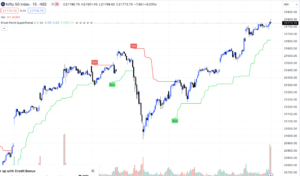
TradingView stands out as one of the most popular and user-friendly charting platforms in the financial community. It offers a cloud-based solution with a social networking aspect, allowing users to share charts and trading ideas. The free version provides a robust set of features, including multiple chart layouts, a wide range of technical indicators, and the ability to draw trendlines and shapes.
- Investing.com
Investing.com is a comprehensive financial website that not only provides news and analysis but also offers free charting software. Its intuitive interface allows users to customize charts with various technical indicators, drawing tools, and time frames. Real-time data and the ability to track multiple financial instruments make Investing.com a valuable resource for traders.
- StockCharts
StockCharts has been a staple in the financial industry for charting and technical analysis. While it offers premium services, it also provides a selection of free charting tools. Users can access a wide range of technical indicators, overlays, and chart styles. The free version has limitations on the number of indicators per chart, but it still serves as a powerful tool for technical analysis.
- ChartNexus
ChartNexus is a standalone charting software that caters to both novice and experienced traders. It provides end-of-day data and supports a variety of technical indicators. ChartNexus is especially popular among stock market enthusiasts for its simplicity and ease of use. While it lacks real-time data in its free version, it remains a valuable tool for those who primarily engage in end-of-day analysis.
- AmiBroker
AmiBroker is a versatile charting and technical analysis software that offers a feature-rich free version with some limitations. It supports a wide range of data sources, allowing users to analyze stocks, commodities, and indices. AmiBroker is renowned for its advanced backtesting capabilities, making it a preferred choice for traders looking to assess the performance of their trading strategies.
- Yahoo Finance
Yahoo Finance is a well-known financial portal that provides free charting tools for a wide range of financial instruments. Users can access interactive charts with various technical indicators and drawing tools. Yahoo Finance is particularly valuable for investors who want to combine chart analysis with fundamental data, as the platform provides comprehensive financial information for individual stocks.
- MultiCharts
MultiCharts offers a free version of its charting software with limited features but enough functionality to perform thorough technical analysis. The platform supports various data feeds and is known for its user-friendly interface. MultiCharts’ free version is a good starting point for traders who want to explore the platform before considering its premium offerings.
Conclusion
In the ever-evolving landscape of financial markets, free charting software plays a crucial role in empowering traders and investors with the tools they need to navigate the complexities of price movements. The options listed above cater to diverse needs, from simplicity and user-friendliness to advanced technical analysis and backtesting capabilities. As with any tool, it’s essential for users to explore and familiarize themselves with the features of each platform to determine which aligns best with their trading or investment strategies. Whether you are a seasoned trader or just starting, these free charting software options open up a world of possibilities for analyzing and interpreting market trends.


